Guest blog by Jones Anthony
This is a blog series written by the alumni of the Leading Economic Growth Executive Education Program at the Harvard Kennedy School. 65 Participants successfully completed this 10-week online course in May 2021. These are their learning journey stories.
– Growth challenge: Slower economic growth compared to neighboring countries
– Country/region/municipality: North Macedonia (NM)
- What are some key ideas/learnings that you will take away from this course?
I gained a deep understanding of several key economic growth and public policy ideas from the course. The Product Space analysis is a game-changer for my work on all future targeted industry strategies. Instead of focusing primarily on the industry concentrations and their growth rates (Location Quotients) for a country/region/city, I am now equipped to target those more complex industry sectors that will have the biggest impact on advancing economic growth and increasing the knowhow of the economy. I am also eagerly awaiting the City/Region Complexity Index in May, which I believe will be transformational for local economic development practitioners across the globe.
The PDIA toolkit has articulated public policy dynamics that I have experienced throughout my career, but lacked a thorough understanding to navigate. The Change Space, Policy Design Space, and Authorizing Environments have been extremely enlightening for me and will help me guide the policy development process for all future economic growth projects. Focusing on problems instead of presenting existing solutions (Asymmetric Mimicry) has shifted my approach for future consulting proposals and I look forward to the opportunity to craft a Fishbone diagram with a group of key stakeholders during my next project. In addition, utilizing the Searchframe approach, compared to the Logframe approach, is a target that I hope to utilize for upcoming project opportunities with various donor agencies.
The Growth Diagnostic process was fascinating, but I have to continue to read the research provided to more effectively facilitate answering the question tree and properly identifying the most binding constraint to growth for my target community. I believe I understand the principles and theory behind the growth diagnostic framework, but I need to work more on implementation and data analysis to effectively put this theory into practice.
- What progress did you make or what insights did you have about your growth challenge throughout the 10-week time period?
I made strong progress on my growth challenge throughout the course. The more research I did, the more I modified my Fishbone Diagram. Having a project that is not within my existing country nor within an existing employment position made it more difficult to engage with stakeholders to get a better understanding of the problem. But I utilized as many data sources as possible to expand my understanding and frequently completed desktop research on existing donor programs and research to inform my problem definition. This was a very fruitful exercise because it would be the same activity I would complete if put on assignment for an economic growth project in NM.
The ‘sense of us’ discussion was challenging because NM continues to struggle in this area. Their efforts to become integrated into the European Union have been negatively impacted on two separate occasions by two separate countries. Their ‘sense of us’ is being challenged in regard to their name and language, which are core components to a country’s identity. This challenge is going to be difficult to overcome, but the research provided from the course is going to be helpful in understanding opportunities for advancement.
- How are you using or will you use what you have learned in this course?
As previously referenced, I have already incorporated the PDIA approach into proposals for economic growth strategies throughout the state of Ohio and for USAID projects in North Macedonia and Sri Lanka. Leveraging the PDIA policy development process with the economic complexity framework has been instrumental for me in making innovative proposals that incorporate these approaches when implementing economic growth strategies.
I plan to continue researching and analyzing the literature provided by the course to continue growing in my understanding of the material and concepts. I’m hopeful to also proselytize the value of City/Region Complexity Index for communities throughout the USA through my membership with the International Economic Development Council and the Ohio Economic Development Association.
- What open questions do you have that you wish the next course could answer?
I found the program to be very generous in regard to providing available research material on a wide variety of topics. I sincerely appreciate that fact because my professional experience has shown me that obtaining academic research can be cost-prohibitive when doing public policy development work.
I would like to better understand the econometric theory used to create the Product Space. This would allow me to better understand the connections between products, which would be helpful to gain buy-in from economic development policymakers. I also think it would be helpful to provide additional examples of what data sets and data gathering activities can be utilized to complete the decision tree for a Growth Diagnostic.
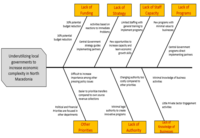
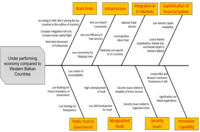
- Feel free to add photos of your fishbone diagrams, assignments, meetings, or whatever you think is relevant (video/audio).
After thoughtful discussions with my classmates and teaching assistants, I realized that I was trying to facilitate a pre-existing solution when I made my initial problem definition. My first and last fishbone diagrams are below that show the change from Week 3 to Week 9 of the program. I feel I progressed in my thinking on how to promote economic growth in NM and look forward to the opportunity for implementation!
To learn more about Leading Economic Growth (LEG) watch the faculty video, and visit the course website. This blog was originally published by the Building State Capability program. Visit their blog for more learning journey stories.