Contact: Chuck McKenney
Email: chuck_mckenney@hks.harvard.edu
Phone: (617) 495-8496
Date: September 12, 2018
Cambridge, Massachusetts – In the study of economic growth strategies, Harvard’s Center for International Development (CID) has added a major missing piece to the data landscape. The Center’s Atlas of Economic Complexity now features trade in services, including tourism, transport, finance, and telecom for over 170 countries. This marks the first known platform to offer services trade data visualized alongside goods trade. Trade data on goods, long a feature of The Atlas, now include the 6-digit product classification level to offer detailed visualizations on country trade for more than 5,000 goods for every country in the world.
“Trade in services has always been an important missing link in analyzing paths to growth,” said Ricardo Hausmann, director of CID, professor at the Harvard Kennedy School (HKS), and the leading researcher of The Atlas. “The new visualizations highlight just how disparate trade in services is across countries. The new data explain the competitive strengths of India, Panama and Ireland, which have seen trade in services become a major source of income growth.”
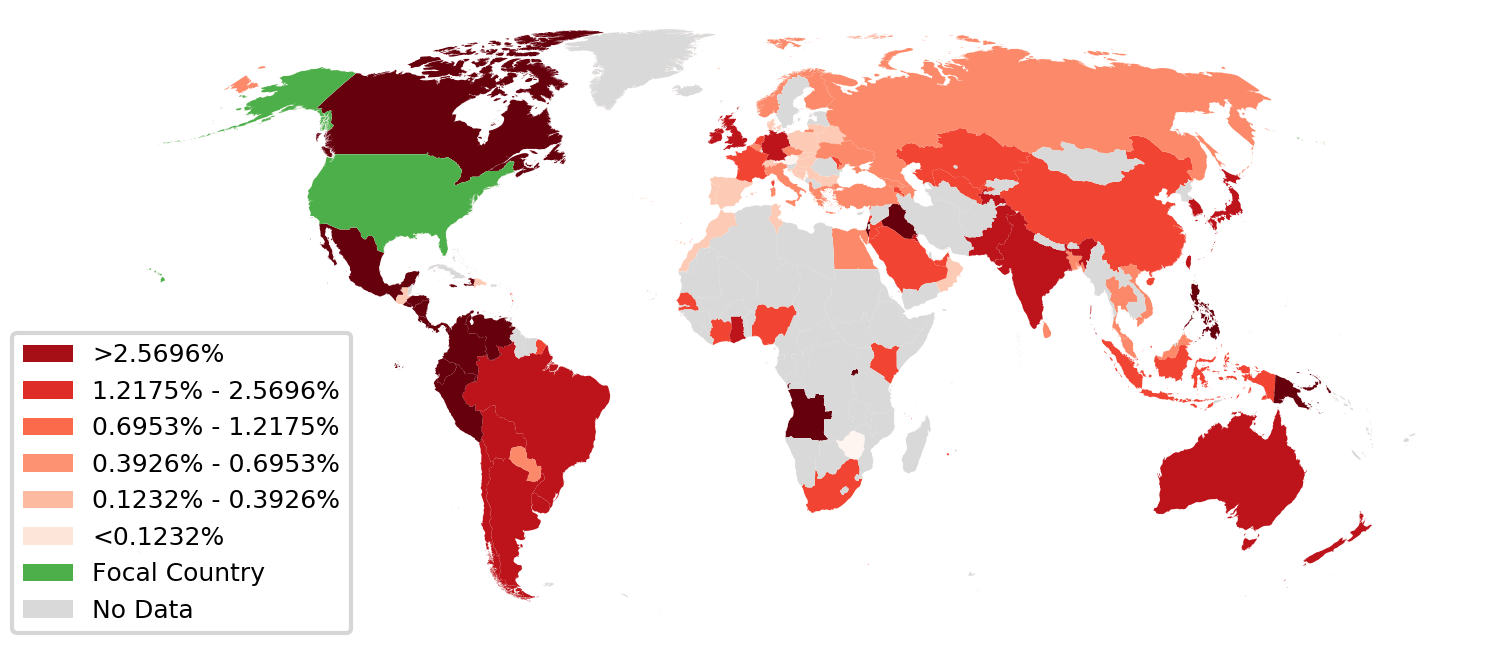
Service exports represent nearly one quarter (23.2 percent) of global exports, totaling $4.77 trillion in 2016. The largest service exporters are: The United States ($752 billion), the United Kingdom ($331 billion), Germany ($281 billion), France ($236 billion), and China ($208 billion). Traded services represent more than one-third of country exports for a wide-ranging set of countries that include India, the Dominican Republic, Kenya and the United States.
Trade in services covers four categories of economic activities between producers and consumers across borders:
- services supplied from one country to another (e.g. call centers)
- consumption in other countries (e.g. international tourism)
- firms with branches in other countries (e.g. bank branches overseas)
- individuals supplying services in another country (e.g. IT consultant abroad)
The Atlas researchers note that the lack of a grasp on the contributions of traded services – both in theory and in basic data visuals – has biased development strategies away from one of the most dynamic parts of the global economy.
“The new visuals highlight the major role services play in global trade,” said Timothy Cheston, a CID researcher on the project. “Trade data are best understood as a signal of what a country knows how to do and what it can afford to buy based on what it earns. The valuable piece of a country’s production, only partially captured in the data, is its technological knowhow. It is this knowhow that defines the diversity and sophistication of what a country produces. Expanding and diffusing the knowhow in an economy must be the central focus of economic policy.”
The Atlas researchers warn that services trade data face greater limitations in their use due to the nature of their reporting. Services trade data do not flow through customs offices; rather, countries unilaterally report their service exports and imports to the IMF, as a total amount, without breaking out the data by partner country. By contrast, goods trade data are reported by both importer and exporter across all country pairs, which allows for a validation process for countries that never report their exports via importers’ reporting. Country coverage of traded services is more limited as a result, with 192 countries having reported services exports at some point and the latest 2016 reporting covering 171 countries. Certain years may be missing for a country due to undisclosed or delayed reporting, without an alternative source to estimate the total. The number of countries reporting trade in services has been increasing, with services data available starting in 1980 when approximately 120 countries reported.
The services data included in The Atlas are available for the treemap and stacked graph visualizations and are taken from the IMF and classified across five categories: information and communication technology (ICT); insurance and finance; transportation; travel and tourism; and unspecified services. Traded services are classified according to EBOPS 2010 (Extended Balance of Payments).
Five Countries with Traded Services to Watch
INDIA AND CHINA

Services are a more significant contributor to India’s overall exports than in China, at 38 percent and 8.3 percent, respectively. In absolute terms, however, China is the larger exporter of services, at $208 billion as compared to $162 billion in India. While less discussed than its neighbor and economic rival, China’s ICT sector, at $123 billion, is larger than India’s ICT exports, at $116 billion, according to the latest 2016 data.

In India, advances in information technology, from call centers to the digital economy, have created an ICT sector that is nearly three times larger than any other export sector. The ICT sector in India has also grown at a blistering pace, at 16.2 percent compound annual growth rate (CAGR) since 2000, outpacing the rapid growth of its exports overall, at 12.8 percent CAGR. Traded services in China are similarly dominated by ICT. In contrast to India, growth in traded services, at 6.2 percent annually (CAGR) since 2000, has failed to keep pace with overall export growth that eclipsed 11.0 percent annually over the same period. ICT has grown at an even slower pace, at 4.7 percent annually since 2000.
At these long-run growth rates, India’s ICT sector is expected to now be larger than China’s for the first time in the forthcoming reporting of 2017 data. Overall, India’s traded services are expected to equal China’s in 2019 before surpassing them.
UNITED STATES OF AMERICA
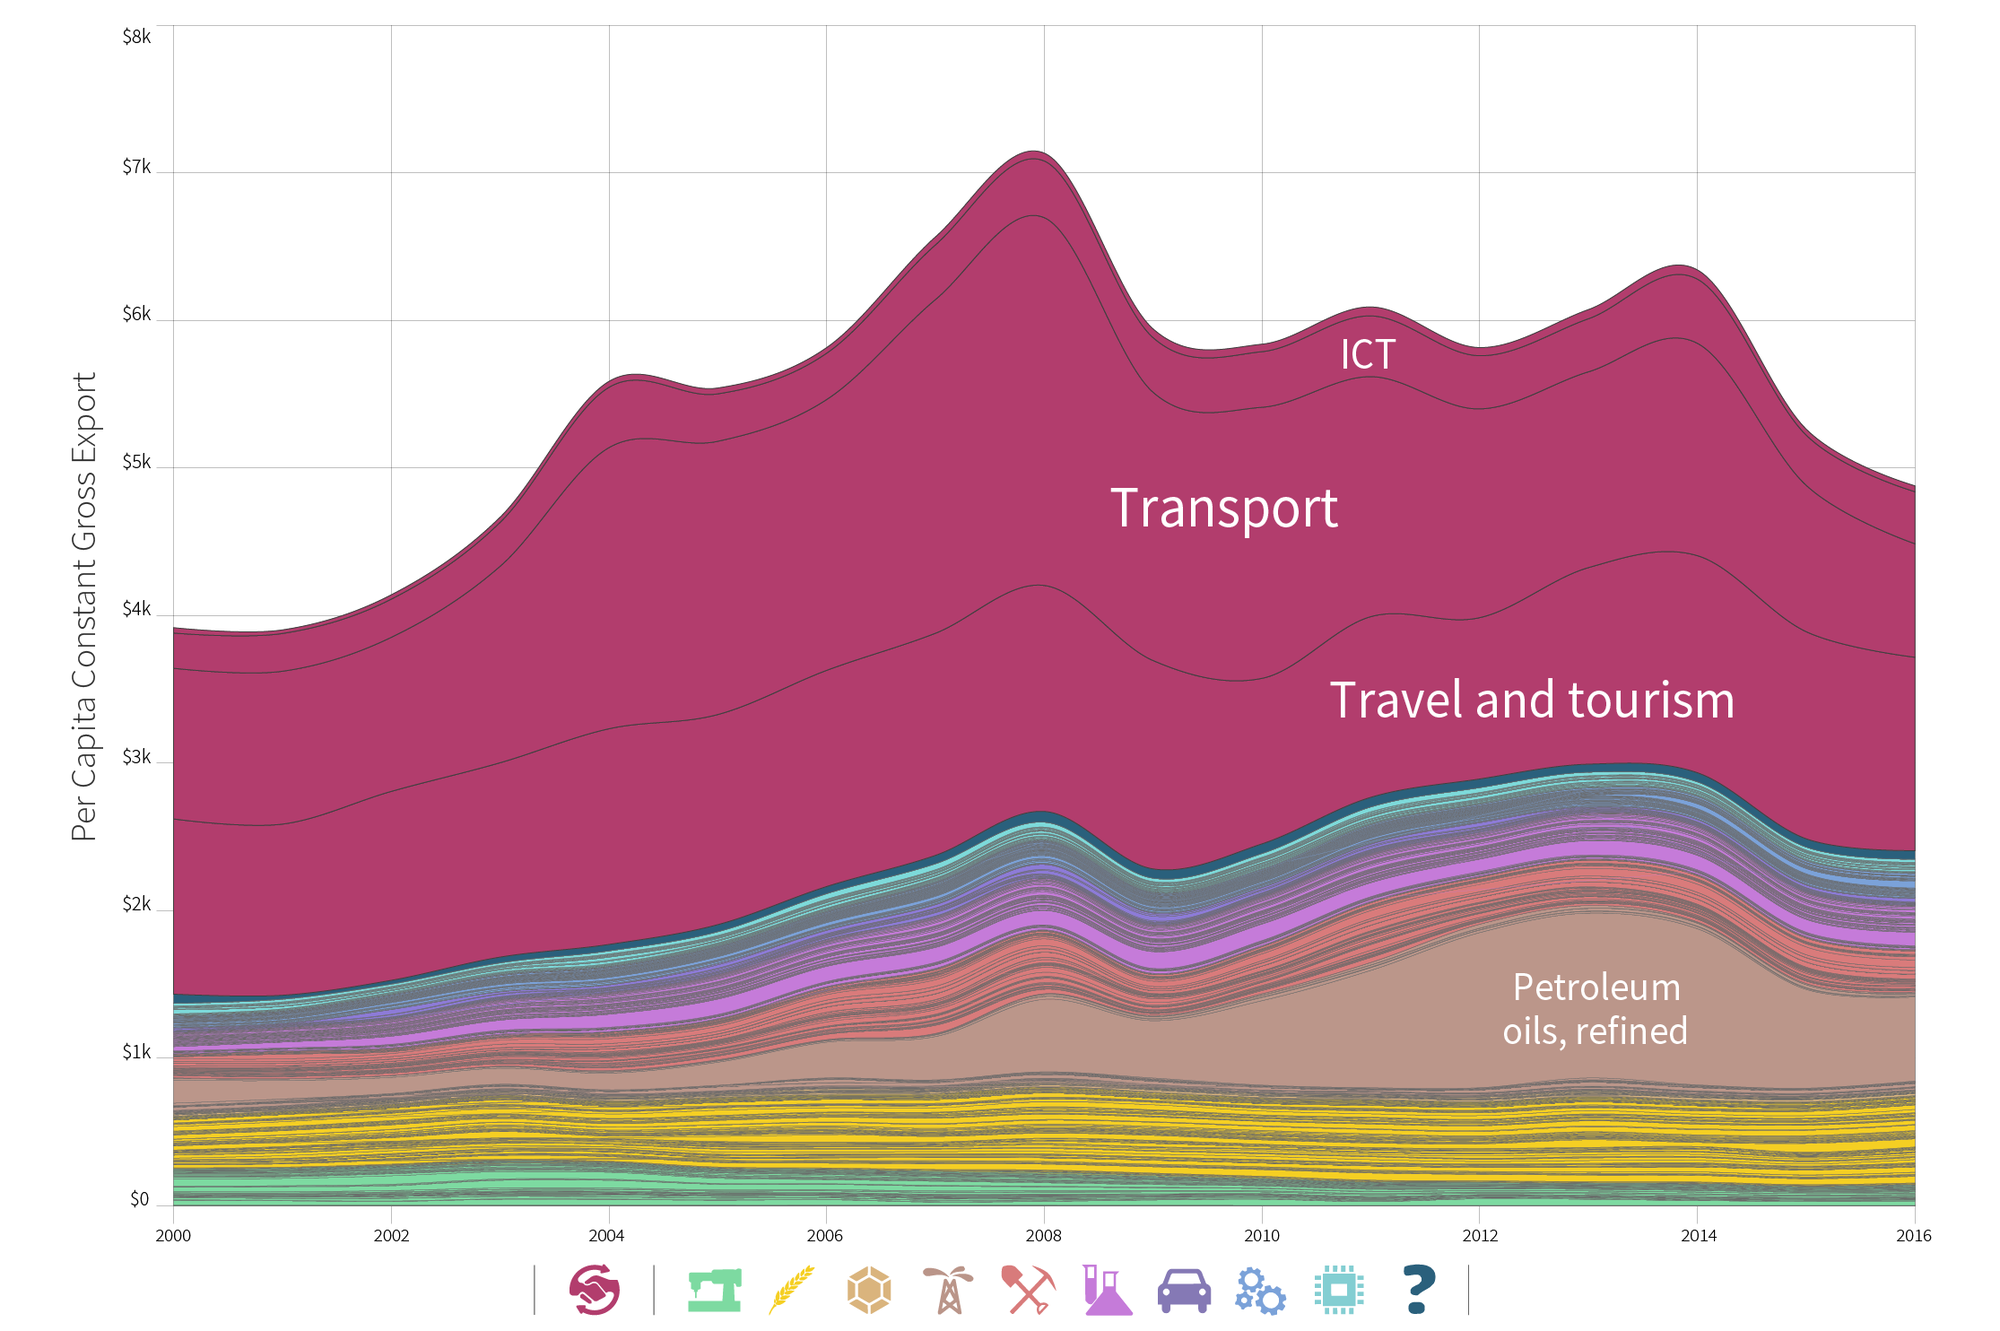
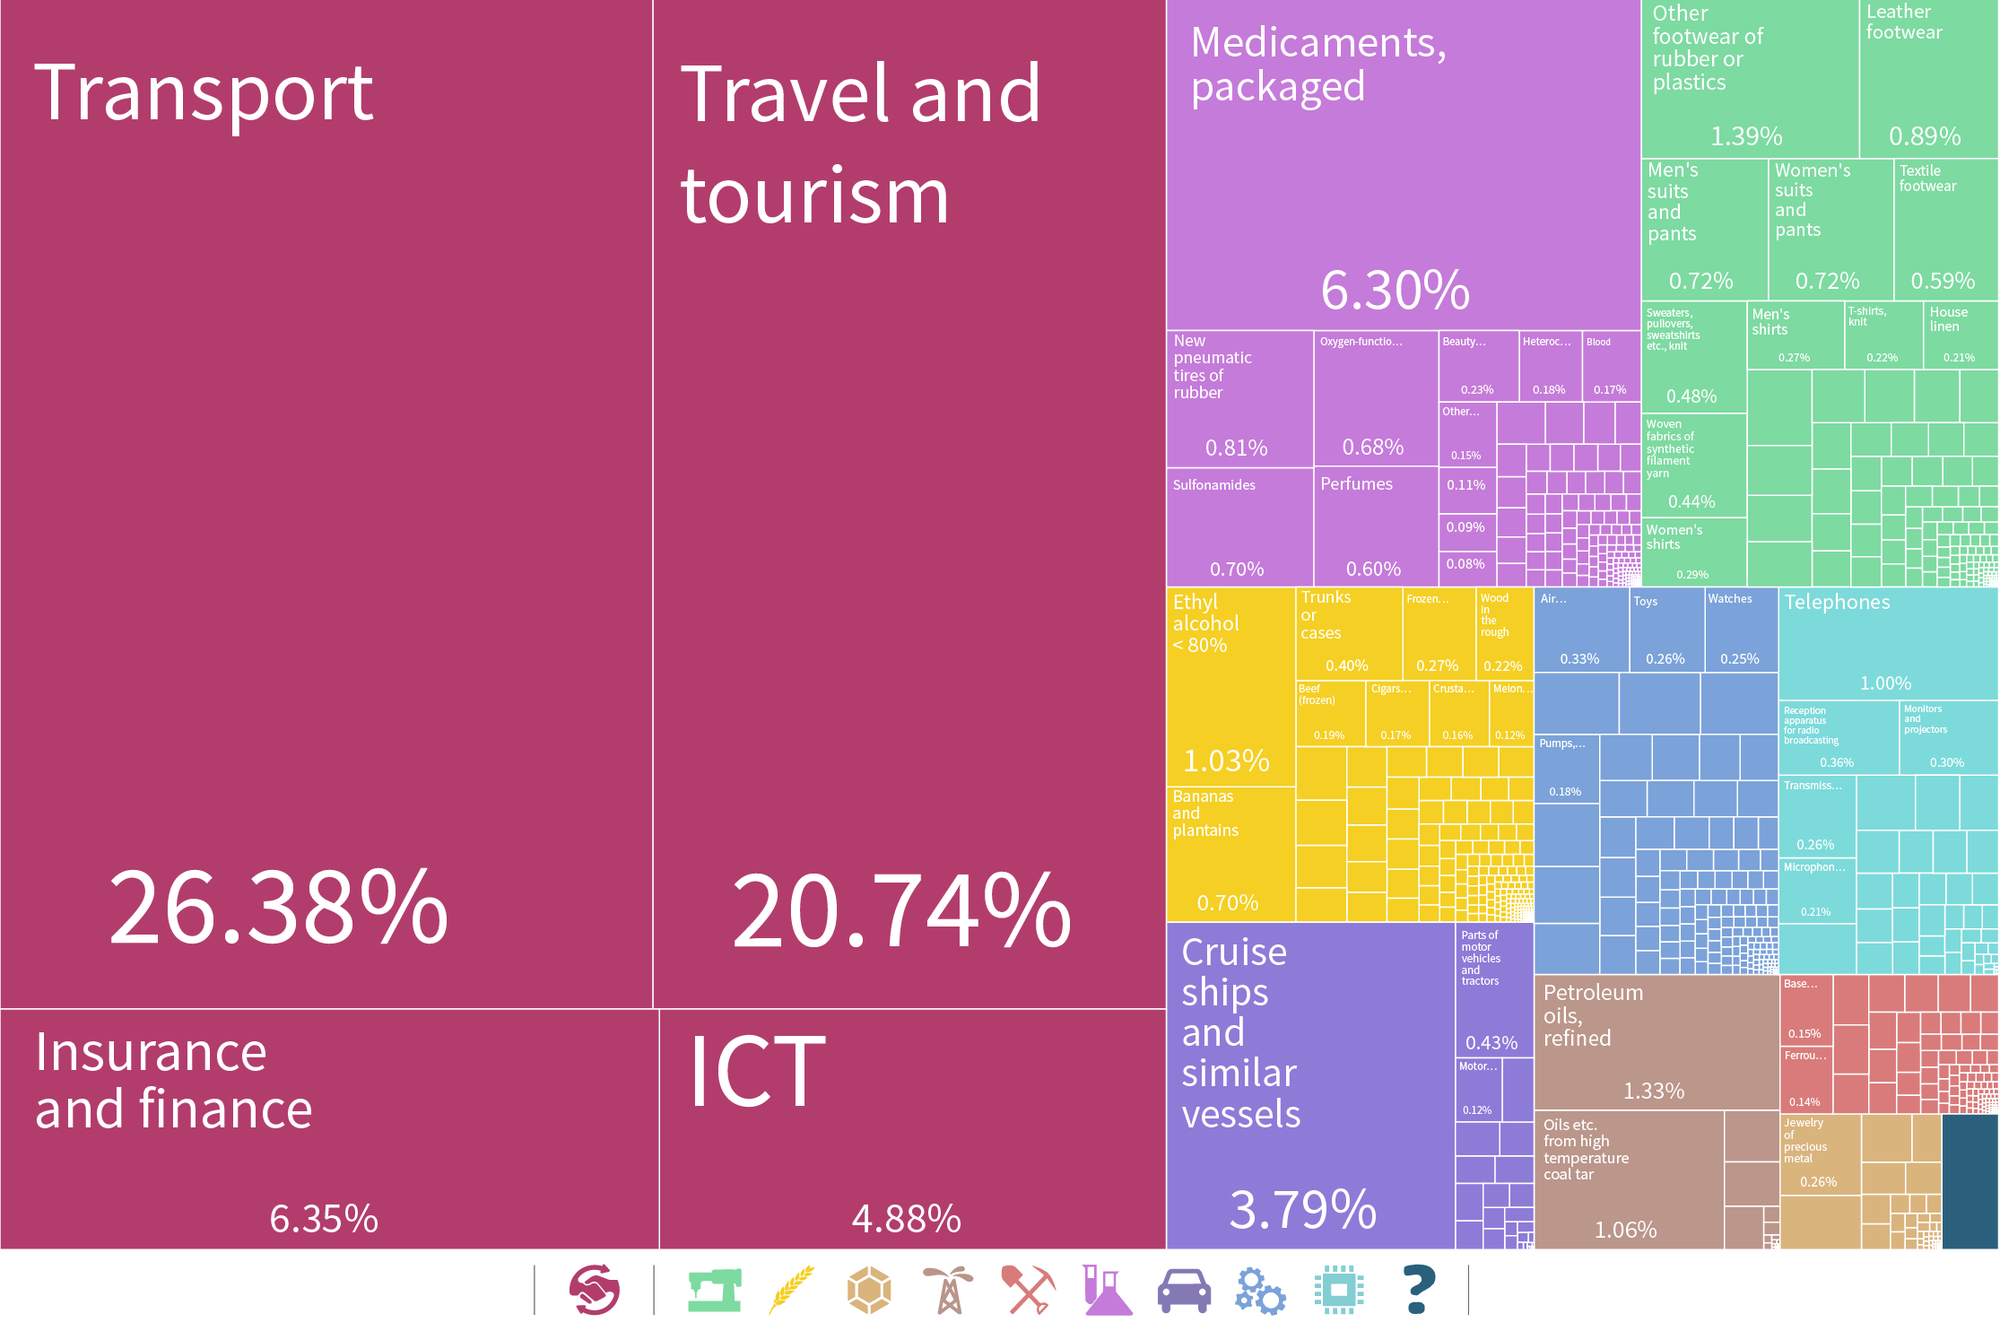
The largest exporter of traded service globally is the United States. At $752 billion in 2016, traded services contribute more than one-third (34.2 percent) of U.S. exports. Within traded services, ICT is the main contributor at 15.8 percent of all U.S. exports. The next most important contributor is tourism and travel, at 9.4 percent of all U.S. exports.
Tourism and travel receipts for the U.S. are larger than car imports and four times larger than car exports. Tourism also generates more jobs per dollar of export, yet tourism services have received less policy attention and the negative effects of changes in visa policies with the travel ban enacted by the Trump administration on travel from several predominantly Muslim countries.
GREECE
The addition of traded services offers a more complete explanation of growth dynamics in countries like Greece. With the majority of its goods exports composed of minerals and agricultural, Greece ranks as the 58th most complex economy in the 2016 Economic Complexity Index. Greece is joined in the ranking alongside Indonesia and Kyrgyzstan, but with an average income that is a multiple of those other countries. What explains Greece’s disproportionately high incomes for its level of complexity? Traded services help explain a major piece of the puzzle. Traded services represent the majority of Greece’s exports, at 50.7 percent of the $54.6 billion total. Tourism and travel are the dominant sector in 2016 at 26.9 percent of total exports. Before Greece’s debt crisis, services contributed 62.6 percent of its $81.1 billion export basket in 2008, with transport services serving as the lead sector. While Greece’s exports lost one-third of their total value since the start of the debt crisis in 2008, not all sectors have been equally affected. Transport services lost 70 percent of their value since 2008, as the core contributor of nearly three-quarters of the total export declines over the period. Other services like tourism and travel have fallen only 15 percent below their 2008 peak. Traded services explain a significant drag on Greece’s economic performance.
PANAMA
Including traded services also reveals the economic base of economies like Panama, a global leader in transport services. Traded services contribute 58.4 percent of all of Panama’s exports in 2016, with transport services dominating at $5.6 billion or 26.4 percent of the export total. A decade of promotion of Panama as “more than the canal” appears to have paid off as tourism and travel now represents the second largest sector, with 20.7 percent of the export total. The creation of a regional airport hub and airline has generated dual benefits to increase air transport services and tourist stays in Panama. Travel services have grown at a rapid pace of 15.2 percent CAGR since 2000, outpacing both transport growth (10.4 percent CAGR) and goods exports (8.3 percent CAGR) over the same period.