Researchers at Harvard’s Center for International Development Also Identify Five Economies to Watch
Cambridge, Massachusetts – Countries that have diversified their economies into more complex sectors, like India and Vietnam, are those that will grow the fastest in the coming decade. That is the conclusion of new growth projections presented by researchers at the Center for International Development at Harvard University (CID). India and Uganda top the list of the fastest growing economies to 2026, predicted at 7.9 and 7.5 percent annually, respectively. The growth projections are based on Economic Complexity, a single measure of each country’s economy which captures the diversity and sophistication of the productive capabilities embedded in a country’s exports.
After a decade of growth driven by record oil and commodity prices, the researchers find a landscape that has shifted in favor of more diversified economies. In sub-Saharan Africa, growth is shifting eastward from commodity-driven West Africa to East Africa, with Uganda, Tanzania (4th), and Kenya (10th) in the top 10 predicted fastest growing countries globally for the coming decade. These East African countries have seen labor shift out of farming into limited manufacturing sectors, as expressed in a more diversified export basket. Far from an industrial revolution, structural change has been partial and piecemeal across these economies. Notably, a significant share of expected growth is driven by rapid population growth. This contrasts with Southeast Asia where growth has been realized in countries that have engaged in full structural transformation by diversifying production into more complex sectors.
“Southeast Asia continues to dominate the global growth landscape, driven by the diversification of economies into complex manufacturing, but the leading countries have shifted within the region, with the Philippines, Vietnam, Indonesia, and Thailand poised to lead growth in the coming decade,” said Ricardo Hausmann, director of CID, professor at the Harvard Kennedy School (HKS), and the leading researcher of The Atlas of Economic Complexity.
The researchers place the diversity of tacit productive knowledge—or knowhow—that a society has at the heart of the economic growth story. The research dispels conventional policy wisdom focused on innovation policy, as the majority of global growth is driven by local adaptation of existing technologies, rather than true innovation. The fastest growing countries are not producing new products that do not exist globally; rather, they are introducing existing products into new local economies. For example, growth has come easier to Ethiopia in transferring the knowhow to produce shoes into its economy driving up its low-productivity base, than it has been for Japan to develop new knowhow in television screen technologies in its existing high-productivity economy. Knowhow-driven emerging economies have had an easier path to growth by adapting existing products locally than advanced economies have had in producing new global products. As a result, emerging markets are expected to outpace the growth of advanced economies, though not uniformly.
The next decade should see a continued period of convergence in global incomes, as poor countries catch-up to the rich, though the rate of convergence appears to be slowing. The countries at the top of the growth list are also some of the world’s poorest, highlighting the ease of growing from a lower initial income base. This helps explain why India and Pakistan (7th) are predicted to grow faster than China (25th), which has a higher ranking of its economic complexity, but has already realized many of the income gains from a diverse, complex economy. The researchers further point to many low-income countries that will experience low growth rates. “Economic diversification and complexity, in the range and sophistication of products a country makes, are key determinants of long-term growth. Many low-income countries, including Bangladesh, Venezuela, and Angola have failed to diversify their knowhow and face low growth prospects. Others like India, Turkey, and the Philippines have successfully added productive capabilities to enter new sectors and will drive growth over the coming decade,” said Sebastian Bustos, a lead CID researcher in trade and economic complexity methods.


Economic Complexity Index Rankings
The Growth Lab at CID also released new country rankings of the 2016 Economic Complexity Index (ECI), the measure that forms the basis for much of the growth projections. The ECI ranking finds the most complex countries in the world are, in order, Japan, Switzerland, South Korea, Germany, and Austria. Among the most complex countries, the greatest improvements in the decade ending in 2016 have been made by the Philippines, China, Singapore, Romania, and Malaysia. Those countries that show the fastest declines in the complexity rankings in the past decade are grappling with significant political interference in the elimination of productive knowhow, with the largest declines in Venezuela, Gabon, Argentina, and Zimbabwe.
“Countries that produce a few, simple exports will continue to be stuck with low incomes. Global growth is being driven by countries who have increased their economic complexity, by diversifying the set of specialized knowhow to create more, and more complex products,” said Timothy Cheston, a CID researcher on the project. “What unites the fastest growing countries is not one rule system, neither democratic governance, nor education level, nor religion, but a clear policy prioritization of attracting and facilitating the knowhow to enter new productive sectors.”
This measure of economic complexity, of the diversity and sophistication of a country’s productive knowhow, is able to closely explain differences in country incomes. The true value of the measure, however, is in its accuracy in predicting future growth, which it has been shown to do better than any other single measure in predicting growth. The Economic Complexity Index was found to predict growth with five times greater accuracy that the Global Competitiveness Index of the World Economic Forum.
Five Countries to Watch
From the economic complexity index and growth projections, the researchers highlight five countries to watch for the coming decade:
India
- 7.9% Economic Complexity Growth Projection annually to 2026
- 49th Most Complex economy in the world (ECI 2016)
- 0 Positions in Economic Complexity ranking since 2006
India tops the list as the fastest growing country for the coming decade, at 7.9% annually, in the economic complexity growth projections. India has made inroads in diversifying its export base to include more complex sectors, such as chemicals, vehicles, and certain electronics. These productive capabilities far exceed expectations for India’s current income level, which contributes to the projection of rapid growth for the coming decade. The researchers also find India ranks the best on the criteria termed the Complexity Opportunity Index (COI), which measures how easy it is to redeploy existing knowhow to enter new complex products. India’s existing capabilities have not only diversified its exports, but also allow for easy redeployment into related products that depend on those capabilities, making further diversification relatively easy. The top ranking in COI means India has many unrealized opportunities to diversify into related, high-value sectors to continue to drive productivity growth and job creation. Up to now, that potential remains unrealized, however, as India’s complexity has not changed over the past decade. The rapid growth that is predicted is effectively capitalizing on previous gains in complexity. Ensuring the long-run potential of growth will rely on realizing diversification into related products. The other major challenge will be to ensure the inclusive nature of this productive transformation, as the gains made in new chemical, vehicle and electronics exports are highly concentrated in specific localities of the subcontinent. Whether that knowhow can be disseminated into new areas of India will in part determine whether rapid growth can be sustained in the long-term.
China
- 4.9% Economic Complexity Growth Projection annually to 2026
- 18th Most Complex economy in the world (ECI 2016)
- 13 Positions in Economic Complexity ranking since 2006 (10th best improvement globally)
China’s growth will continue to be amongst the top quintile of global countries for the coming decade, according to the projections. Yet, the rate itself will represent a marked slowdown from decades past. China is expected to contribute one third of total growth globally for 2018, and yet the growth rate is expected to fall a full percentage point from last year. The Economic Complexity projections show this growth is likely to continue to slow to 4.9% annually for the coming decade. According to the economic complexity research, the slowdown is not being driven by a lack of economic complexity, as China ranks as the 18th most complex economy globally, rising 13 positions over the past decade. Rather, China has already realized many of the income gains from its rising complexity, doubling per capita income in less than a decade. The economic complexity growth projections therefore have China growing above the world average, though at 4.9 percent annually for the coming decade, the slowdown in growth is expected to continue as China has already realized many of the income gains from its rising complexity.
The latest 2016 trade data also show a second-year of decline in China’s export volumes, the first time its exports have fallen in consecutive years in a half century, since 1966-1968. Textile exports show significant declines, along with computers, which experienced one of the largest single-product declines, falling by $28 billion in exports over the two years. Policy priorities in the government have also shifted toward diversification of services, driving new growth opportunities. However, this news of the downturn in China’s exports comes just as the Trump administration proposes broad-sweeping tariffs on Chinese goods to the U.S., raising the prospect of a trade war. After three decades of historic growth and poverty reduction, the potential for China’s export-led growth has never likely faced greater risks. And yet strong growth is likely to continue into the long-term, as China remains at the forefront of economic complexity.
Uganda
- 7.5% Economic Complexity Growth Projection annually to 2026
- 4.1% Per-capita Economic Complexity Growth Projection annually to 2026
- 75th Most Complex economy in the world (ECI 2016)
- 27 Positions in Economic Complexity ranking since 2006 (#1 best improvement globally)
Uganda ranks second in the economic complexity growth projections and is expected to sustain a rapid pace of 7.5 percent annually to 2026. Rapid growth derives from Uganda’s climb in the Economic Complexity Index ranking, as the country has risen 27 spots to be the 75th most complex economy globally. While this ranking leaves significant room for improvement, it also far outpaces the country’s expected complexity for its income level, leading to the projection of rapid growth. Uganda has made inroads into basic chemicals, such as paints and hair preparations, and packaging products, while also diversifying a large agricultural export sector to include select processed foods. The average complexity of Uganda’s exports has therefore risen, but also opened opportunities to redeploy the knowhow behind the new packaging or food processing into related products, to allow for further future diversification. This diversification has contributed to stronger, if volatile, growth in Uganda, where income per capita doubled in the last 20 years. Achieving the 7.5 percent expected growth would not be unusual for an economy that reached that rate four times in the past decade, though sustaining that growth rate would be a significant achievement. A recent report by CID entitled How Should Uganda Grow? notes that growth is being driven by services, while incipient manufacturing industries may be threatened by the discovery of oil realigning priorities away from diversification efforts.
Uganda joins two other East African countries (Kenya and Tanzania) in the top 10 of the predicted fastest growing countries for the coming decade. The region’s growth prospects are largely driven by rapid population growth, however, as none of the three falls in the top 10 for growth on a per capita basis. The growth projections show Uganda’s per capita growth to be 4.1 percent annually for the coming decade, a more modest rate. Nevertheless, the potential remains for a policy agenda to prioritize diversification into new tradable industries that take advantage of recent gains and the population boom to drive growth.
High-Potential New Exports for Uganda
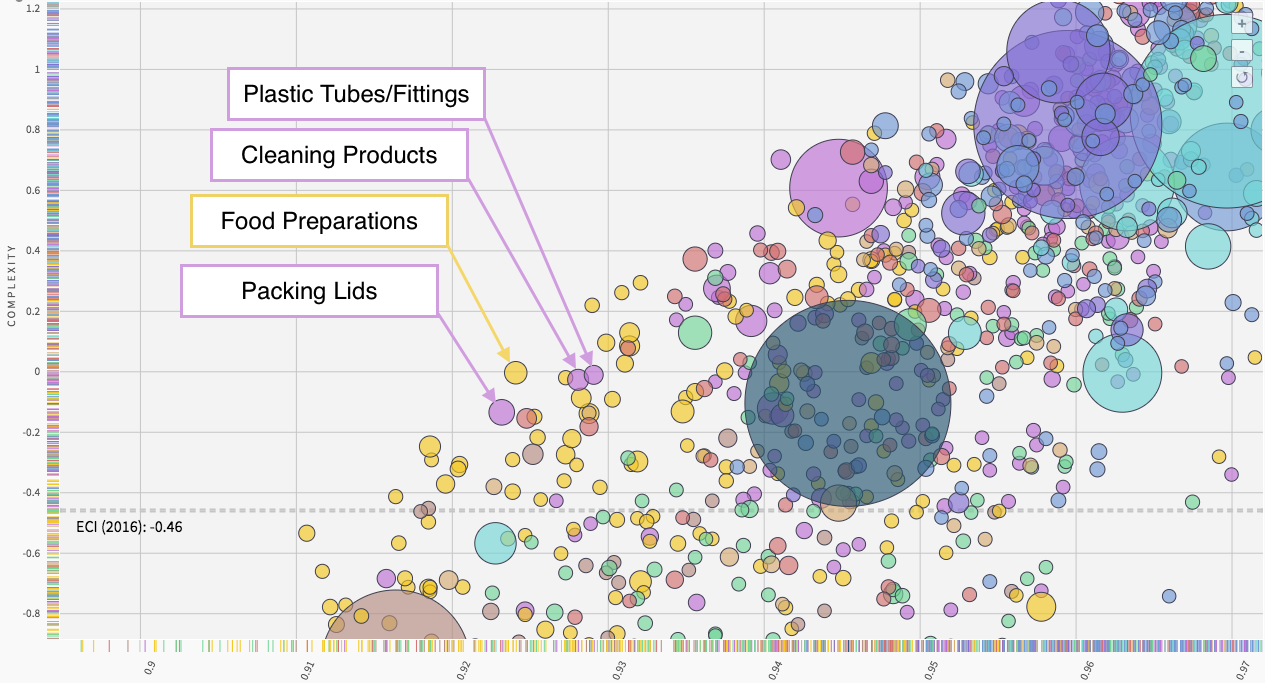
How “nearby” distance is to existing products/knowhow

Source: Atlas of Economic Complexity
Vietnam
- 5.9% Economic Complexity Growth Projection annually to 2026
- 56th Most Complex economy in the world (ECI 2016)
- 16 Positions in Economic Complexity ranking since 2006 (8th best improvement globally)
At 5.9 percent annually to 2026, Vietnam is expected to be the 9th fastest growing economy for the coming decade. This rapid growth looks to build on a roaring economy that has sustained at least five percent growth every year since 2000. Prospects for the coming decade are being driven by Vietnam’s successful insertion into electronics’ supply chains since 2012. Vietnam grew its small electronics sector with investments in TV and phones that quickly diversified into related electronic integrated circuits and computers. The country has proven effective at adapting higher-productivity technology and knowhow into the local productive ecosystems. Electronics exports have grown by 38 percent since 2011, driven by dual factors of growth within product exports and entry into new products. Looking at future growth prospects, recent gains in electronics have opened further diversification opportunities in the sector, with electrical capacitators and liquid crystal devices among the high-potential, nearby opportunities. The researchers find Vietnam is in the midst of a virtuous cycle of growth via structural transformation: where recent diversification into high-value products drives income growth and opens further opportunities for diversification into related products in the future.
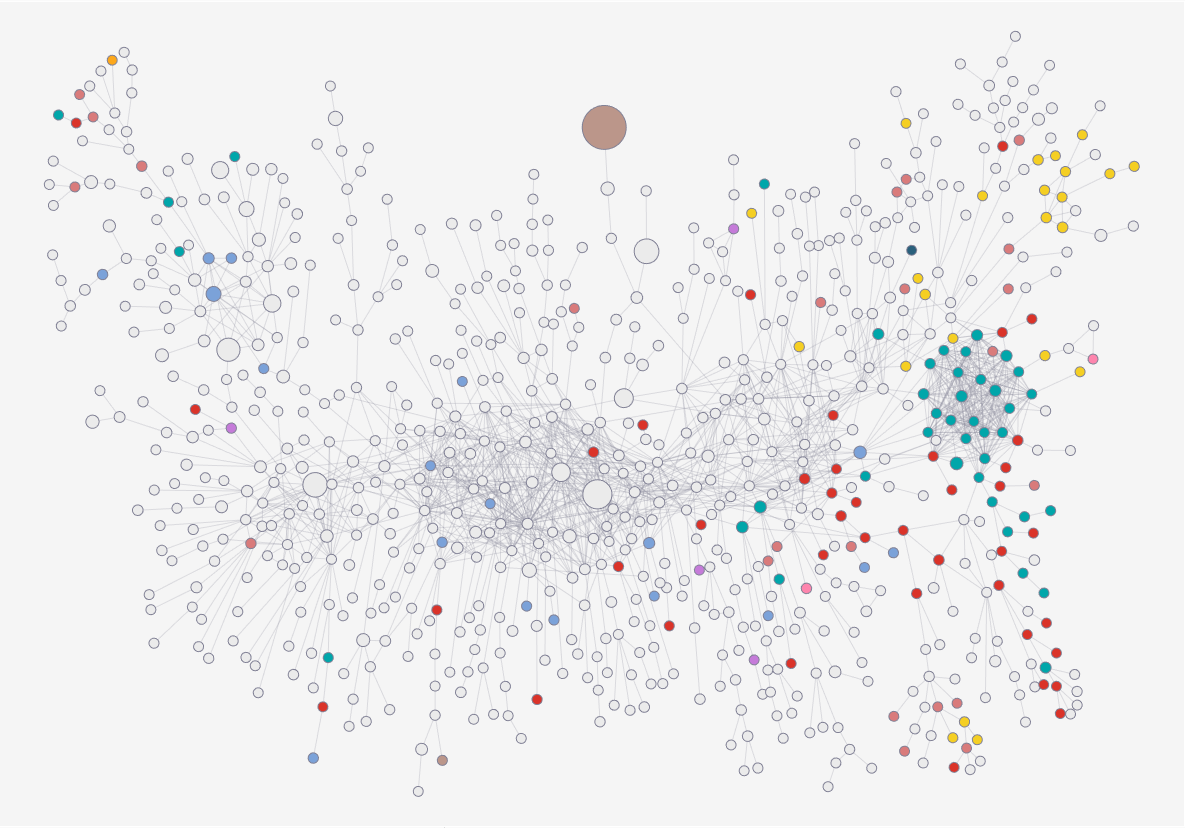
Vietnam’s Export Evolution in the Product Space
2006
2016
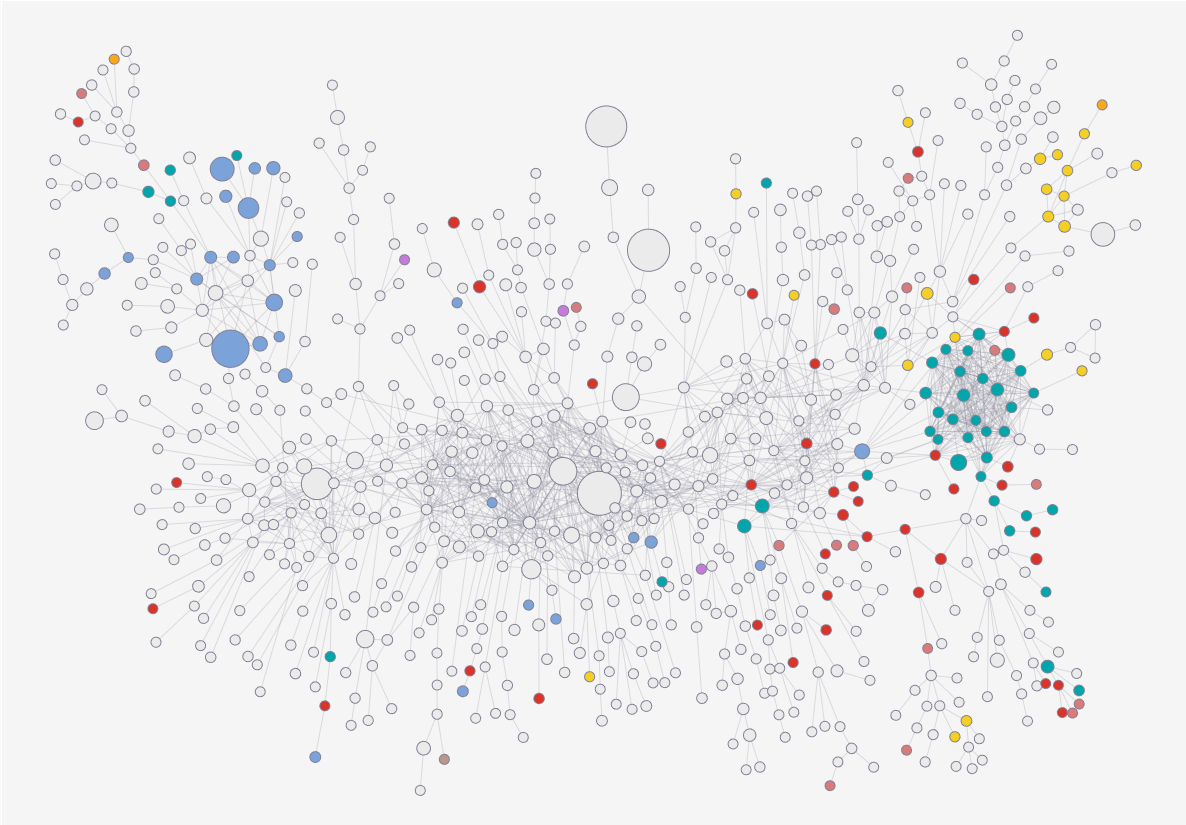

Source: Atlas of Economic Complexity
Mexico
- 4.9% Economic Complexity Growth Projection annually to 2026
- 21th Most Complex economy in the world (ECI 2016)
- 1 Positions in Economic Complexity ranking since 2006
Latin America and the Caribbean’s (LAC) growth prospects look to be led by Mexico in the coming decade. This is to say the region’s growth over the next decade will be led by a country that has spent the past decade underperforming against its potential. Still, it is befitting of the region’s growth prospects when globally it is economic diversification and complexity that have defined growth in the long-run. LAC countries feature low diversification and complexity; moreover, both remain stubbornly low, as neither element has improved over time. As a result, rapid growth on a sustained basis remains elusive in the region. Mexico is a case in point, with the highest complexity ranking in the region and 21st globally, but whose ranking fell one spot over the past decade. Mexico’s export basket remains remarkably stable over the past decade, where the lack of continued diversification into new products may explain the low 4.4 percent compound annual growth rate over the period. The potential for new diversification remains high in Mexico, including major high-value segments of machinery and electronics. CID research also finds significant potential in greater geographic diversification of industries to drive more inclusive growth in Mexico by transferring knowhow to move existing industries from high-income northern states in Mexico to operate in the low-income southern states.
Share of Mexico's Exports: 2006-2016
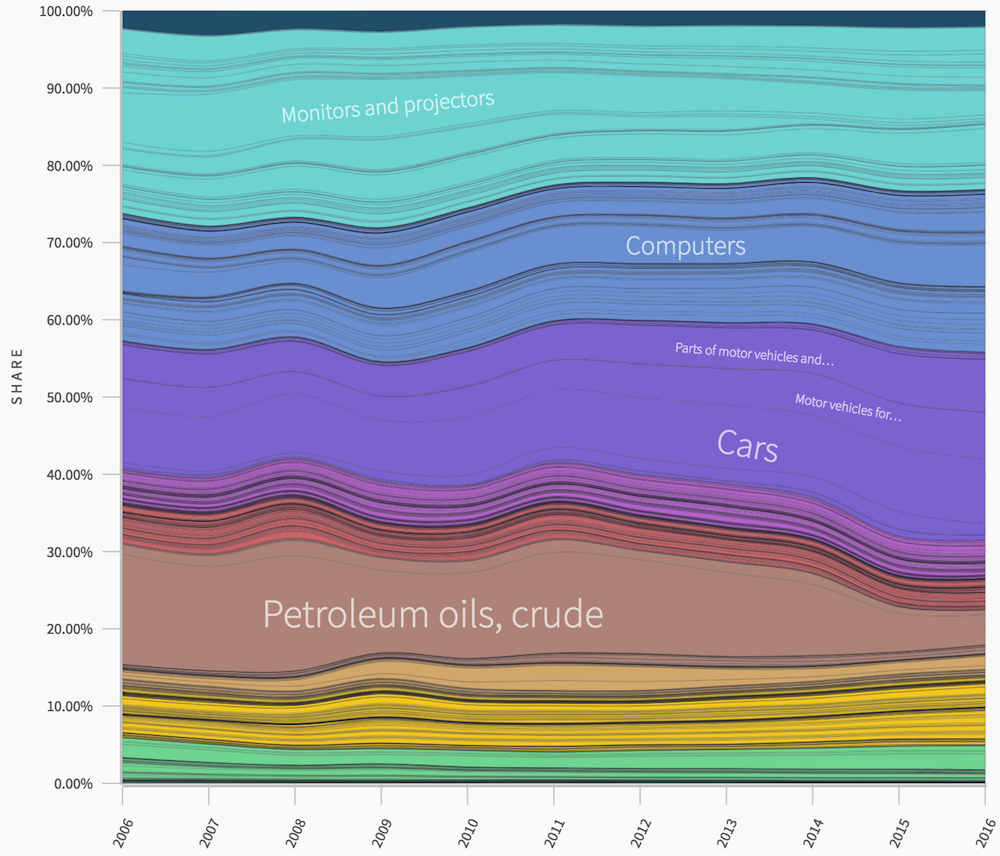
Source: Atlas of Economic Complexity