Tools
More About Our Tools
Our flagship tool, the Atlas of Economic Complexity, allows users to explore global trade flows across markets, track these dynamics over time and discover new growth opportunities for every country. Since its launch in 2013, the Atlas has reached more than 1.5 million people and has active users in almost every country worldwide. Released in 2021, Metroverse takes our research to the city level, providing insights into economic composition, specialization, position in the industry space, and growth opportunities for 1,000+ cities. In addition, we've developed sub-national Atlases, country dashboards, interactive stories, open-source software packages, and working prototypes, all of which can be found on the Viz Hub.
Our digital tools have been featured in various media outlets including the New York Times, Wall Street Journal, Washington Post, Bloomberg, Financial Times, and the Harvard Gazette. In 2022 Metroverse won the Silver Award in the Business Analytics category of the Information is Beautiful Awards. In 2019 we were the 2nd runner up for the Digital Humanities Best Data Visualization Award.
Atlas of Economic Complexity
Build custom data visualizations for any country to reveal 50+ years of global trade flows across 6000+ goods and services, along with new opportunities to drive growth.

Metroverse
Urban economy navigator illustrates the technological capabilities for more than 1,000 cities worldwide and the opportunities for future growth and diversification.
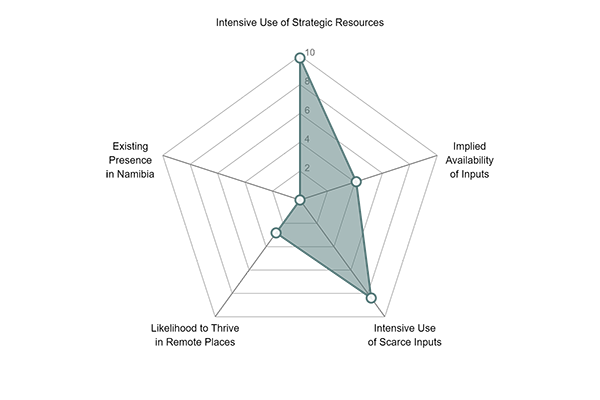
Namibia Industry Targeting Dashboard
Custom-made industry targeting tool allows users to explore the viability and benefit of any product or industry in comparison with Namibia’s current productive capabilities and comparative advantages.

Jordan's Complexity Profile
Displays the results of the complexity analysis developed to provide a roadmap to identify the economic activities with the highest potential to diversify Jordan’s export basket and drive growth, while supporting higher wages.
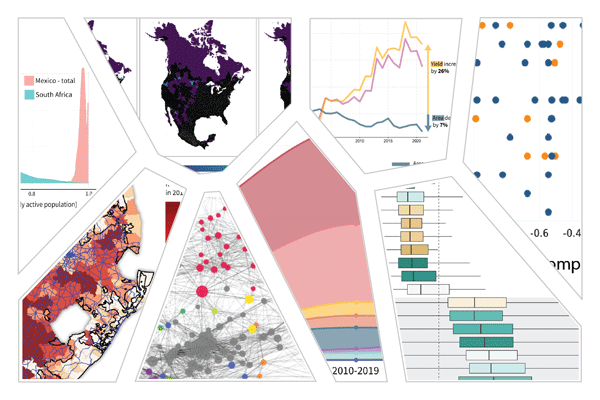
Top Visual Insights of 2023
Our multi-disciplinary team extended our pioneering research agenda to five continents in 2023. Our researchers engaged the world in leveraging decarbonization as a pathway for growth, identifying the barriers to migration and mobility of skills, examining inequality in cities and the effects of remoteness on growth, and understanding the role of innovation in economic complexity.
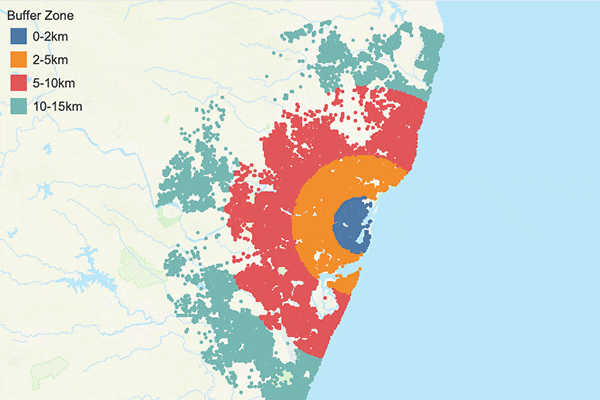
Harboring Opportunity: The Industrial Ecosystems of Port Cities
While we often think about ports as gateways for transporting goods and materials across cities, countries, and continents, it is also relevant to ask: how do ports play a role in shaping their local economies? In this visual story, we explore how port cities can capitalize on their productive strengths to develop other industries.
215+
Countries with active users
2.1
million
New users since 2013
10.6
million
Page views in 2023
30
Tools & software packages shared online
Our Tools in the World


Awards & Press


Data-driven decision-making results in better policy determinations. Metroverse enables users to not only pull important economic development data for their region but see it in the context of other influencing factors, thus deepening one’s understanding of how to ensure and sustain economic growth."
– Barbara Leslie, President & CEO of Oakland Metro Chamber of Commerce
Support Our Mission
Our digital tools are made possible through the support of organizations that align with our mission to advance inclusive growth and prosperity. To learn more about how you can support the Growth Lab, email Andrea Carranza or call (617) 384-5734.